If you are a fan of solar power you have probably heard of pvoutput.org, a cloud service that records and graphs the generation and consumption of member’s renewable energy systems.
The new system is graphed here. If you hunt around you can find my existing grid-tied system too. As of writing, with 3kw of panels and running the pool pump and garden lights, a day looks like this:
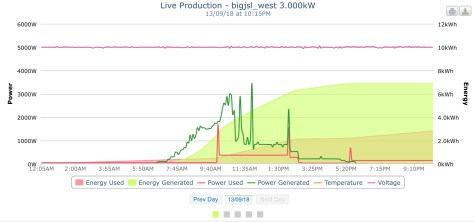
Power is measured in watts “w”. Energy is power over time and the unit often used for electricity is kilowatt hours “kwh”, which is 1,000 watts for 1 hour. It’s also 2,000 for half an hour or 500 watts for 2 hours.
The dark green line is the power out of the solar panels that is charging the battery and running the inverter loads. The red line is the power consumed by loads and the overhead of the inverter itself which is around 50 watts, around 1.2kwh per day. The large green area above the pink “energy used” is the effective energy overheads of the system and losses while the charger tries to “balance” the battery pack. At present I appear to be wasting about 4kwh per day which is quite high when you stop and think about the maximum 20kwh per day the solar panels can produce. That said, my methodology is a little primitive.
The PIP inverter has an RS232 serial port which is “normal” for IT 20 years ago but unusual for solar kit these days where RS485, MODBUS or CAN are much more common. You need to talk at 2400 bits per second, 8 data bits, no parity and 1 stop bit. The protocol has been documented and I found some Python code to talk to the inverter in the AEVA PIP forum but it is for loading data into a database.
Data available includes the voltage and amps from the solar panels, the battery voltage and charge current in integer amps and the voltage and watts being supplied by the inverter to loads.
I cleaned up the existing code that reads the data about once every 1.5 seconds and wrote some that does some maths and logic and then uploads the data to pvoutput every five minutes. You can find my code stashed away on that forum.
I multiply PV volts by amps to get watts which is legitimate for direct current.
I multiply that by the duration in hours since the last sample (about 1.5 seconds but measured to microsecond accuracy by the RasberryPi) to give watthours.
I do the same for the inverter load which is reported in watts (and also in volt amps which is probably a source of discrepancy for those of you who understand reactive loads).
All of this is summed and then uploaded on the first sample after the wall clock minutes are integer divisible by 5. (Remember modulo?)
The next extension to the code is to listen to the Batrium BMS and upload the StateOfCharge% and net current in or out of the battery from it. It’s much more accurate than the integer amps from the PIP inverter.
